Dashboard
App Dashboard
App analytics dashboard provides a summary of the key performance indicators (KPI) of your app or website.


App Selection
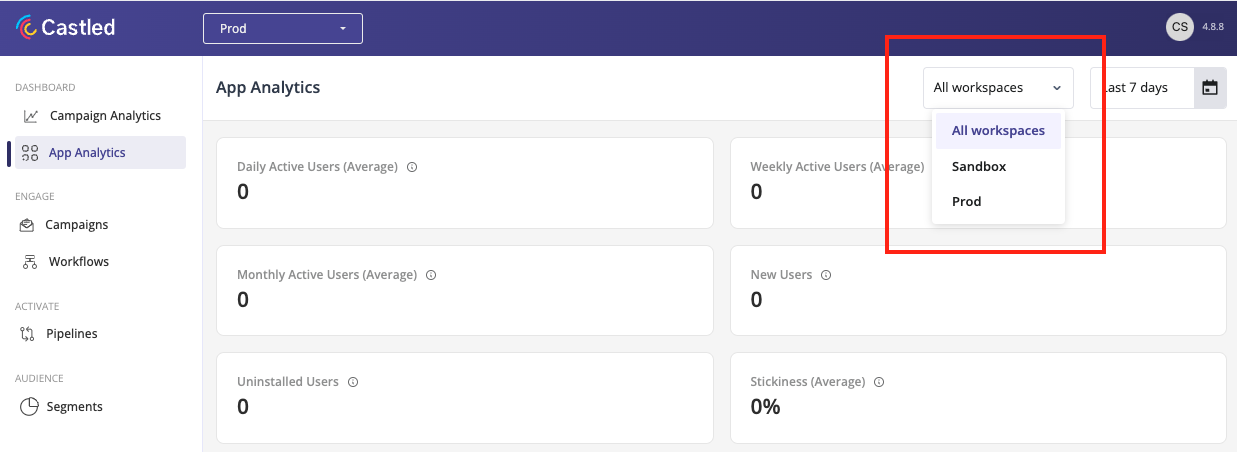
By default dashboard shows combined metrics for all your apps managed by the Castled. To see the metrics for a specific app, you can select the workspace corresponding to that app from the workspace dropdown menu.
Time Period Selection
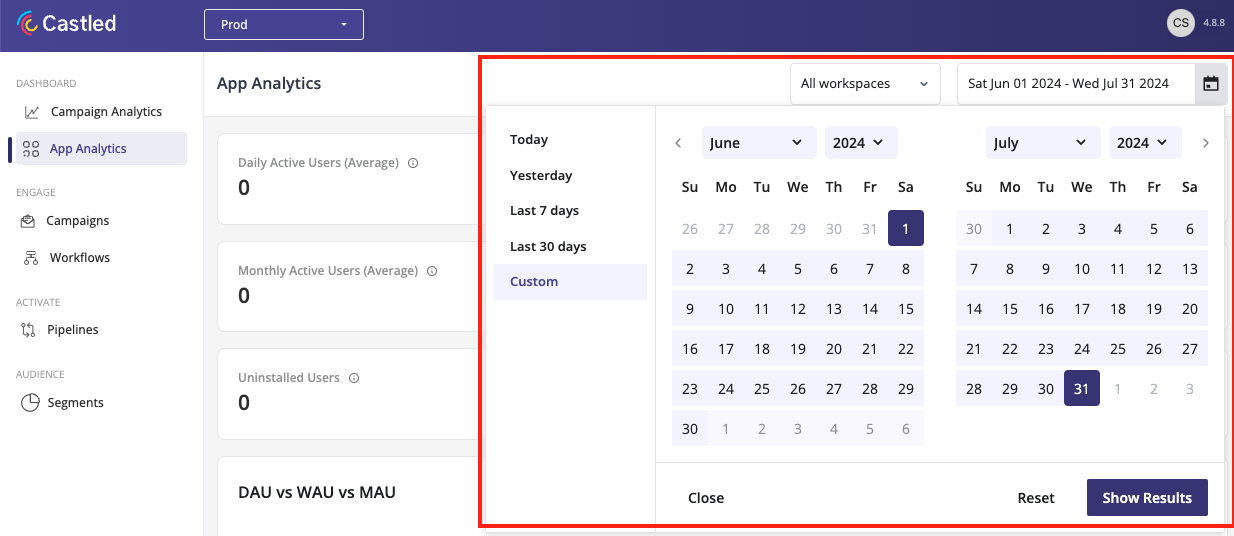
All the KPIs shown are for the selected time period. By default dashboard shows the metrics for the last 7 days. You can choose any time window that you are interested in using the date range selection menu shown below.
Key Metrics
Please find below the list of metrics that we currently track.Daily Active Users (DAU)
Daily Active Users are the number of unique users who visited your app or website on a given day. Monitoring DAU over time helps track the growth or decline of the app’s user base, providing a clear picture of how the app is performing.Weekly Active Users (WAU)
Weekly Active Users are the number of unique users who visited your app over a 7 day period. We use a rolling 7 day window to calculate the WAU. For e.g. WAU on Jul 8, is the number of unique users who were active on your app during the 7 day period starting on Jul 2nd and ending on Jul 8th. WAU for a day is calculated at the end of each day.Monthly Active Users (MAU)
Monthly Active Users are the number of unique users who visited your app over a 30 day period. MAU is computed over a rolling 30 day window. For e.g. MAU on Jul 8, is the number of unique users who were active on your app during the 30 day period ending on Jul 8th. Similar to WAU, MAU for a day is also calculated at the end of each day.Since WAU and MAU are calculated at the end of each day, the values for the
current day will typically appear as 0, unless you happen to check the
dashboard at the end of the day

Stickiness
App stickiness helps determine how engaged and loyal the users of an app are. It is typically calculated using the Daily Active Users (DAU) and Monthly Active Users (MAU) metrics. The stickiness ratio gives an indication of how often users return to the app over a given period. App Stickiness =New Users
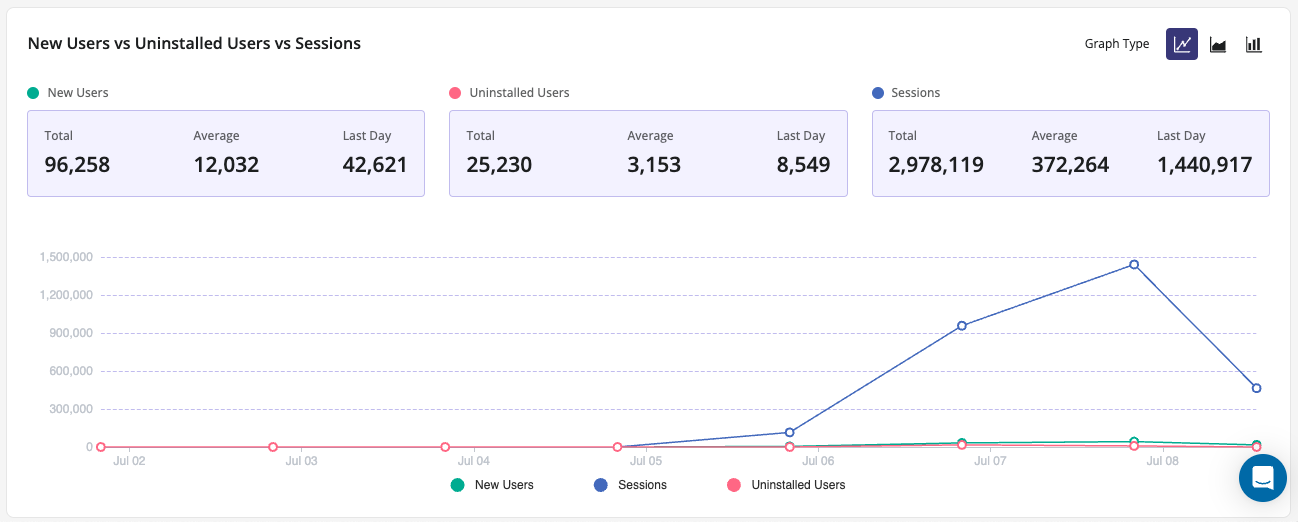
The number of new users who installed your app or registered with your website for the first time. When you first integrate the Castled SDK with your app, all users who upgrade to the new app version will show up as new users as they never logged a session before.Uninstalled Users
The number of users who have uninstalled your app during the selected time period. Uninstallations are currently tracked passively when a push notification is sent to the user as part of any active campaign. Active uninstall tracking is something that we are planning to rollout soon.User Sessions
This metric counts the number of user sessions within your app or website during the selected time period.
For each of the above metrics dashboard also report the following values whenever applicable.
- Average Mean value of a metric over the selected time period. Average is reported on a daily basis.
- Last Day Metric value on the last day of the selected time period.
- Total Sum of the metric value over the selected time period

